Cookbooks
Worked analyses on real data. sportsdataverse-py loads it, sdvplot brings team colors and logos, and sportypy draws the surface and bins the data onto it. Each cookbook is a Jupyter notebook in examples/notebooks, shown with the output of its last run: open it in Colab or download it to run it yourself.
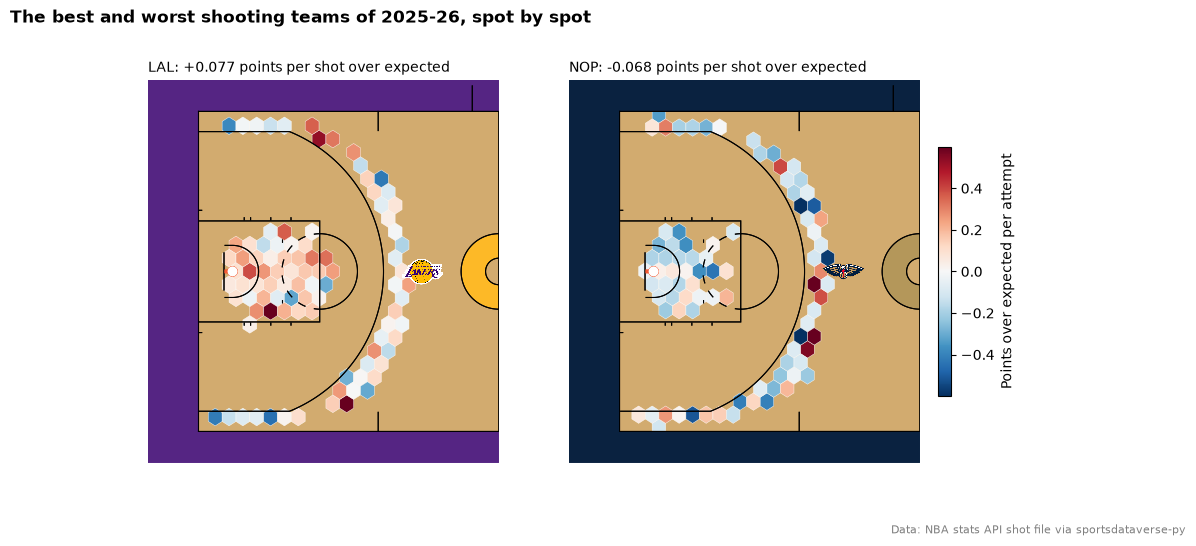 Where the best and worst shooting teams beat the leagueNBA shot quality
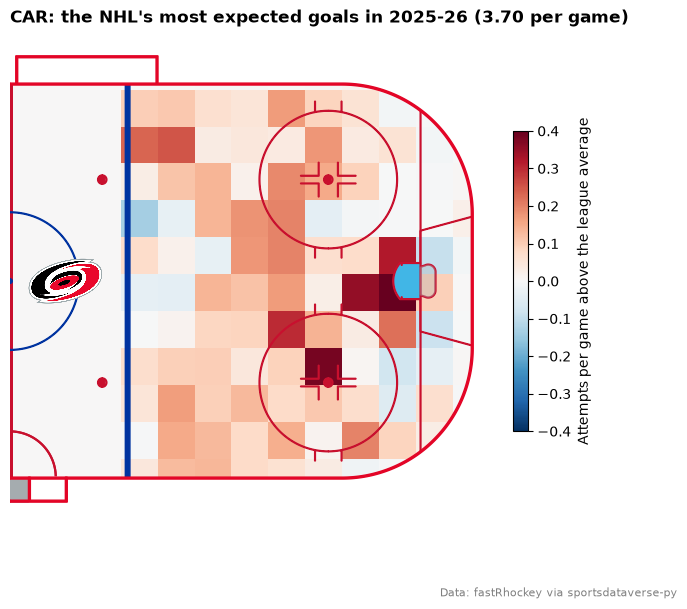 One team's shot profile against the leagueNHL expected goals
Every cookbook
- NBA shot quality: Every 2025-26 NBA shot binned on sportypy's court: where the league shoots, what each distance is worth, and where the best and worst shooting teams beat or trail the league.
- NHL expected goals: Every 2025-26 NHL unblocked shot on sportypy's rink: where shots and goals come from, how well fastRhockey's expected goals model is calibrated, a team's shot profile against the league, and the season's best finisher.