Shot quality on an NBA court
Where does a team take its shots, and does it make more of them than an average team would from the same spots? This recipe answers both for every field goal attempt of the 2025-26 NBA regular season, with three SportsDataverse packages working together:
- sportsdataverse-py loads the shots (the stats-API shot file the SportsDataverse publishes on GitHub, so nothing calls stats.nba.com),
- sdvplot moves them onto sportypy's court and supplies team colors and logos,
- sportypy draws the court and bins the shots onto it with
hexbin.
To run it yourself: pip install sportypy sportsdataverse "sdvplot[surfaces]", or from a clone of the repository, uv run --group cookbook jupyter lab.
Open in Colab · View the notebook on GitHub
import matplotlib.pyplot as plt
import polars as pl
import sportsdataverse.nba as nba
from matplotlib.colors import TwoSlopeNorm

import sdvplot
from sportypy.surfaces.basketball import NBACourt

# print tables as markdown, so the docs site shows them as tables
pl.Config.set_tbl_formatting("ASCII_MARKDOWN")
pl.Config.set_tbl_hide_column_data_types(True)
pl.Config.set_tbl_hide_dataframe_shape(True)
SEASON = 2025  # this loader names a season by the year it starts: 2025 is 2025-26
1. Every shot, on sportypy's frame
The stats API reports a shot's location in tenths of a foot with the hoop at the origin. sportypy's court is in
feet with the origin at center court. sdvplot.court_coords converts one to the other and adds court_x and
court_y; every shot lands on the left half of the court. A shot's value is points when it goes in and 0 when it
does not.
shots = sdvplot.court_coords(
    nba.load_nba_stats_shots(seasons=SEASON).filter(pl.col("season_type_id") == "2")  # 2: regular season
).with_columns(
    made=pl.col("shot_result") == "Made",
    points=pl.when(pl.col("shot_result") == "Made").then(pl.col("shot_value")).otherwise(0),
)
print(f"{shots.height:,} shots by {shots['team_tricode'].n_unique()} teams")
print(shots.select("team_tricode", "player_name", "shot_value", "shot_distance", "court_x", "court_y", "points").head(3))
219,159 shots by 30 teams
| team_tricode | player_name | shot_value | shot_distance | court_x | court_y | points |
|---|---|---|---|---|---|---|
| HOU | Sengun | 3 | 25 | -23.85 | -17.9 | 0 |
| OKC | Holmgren | 2 | 1 | -40.45 | 0.0 | 2 |
| HOU | Thompson | 3 | 23 | -41.75 | 23.3 | 0 |
2. Where the league shoots
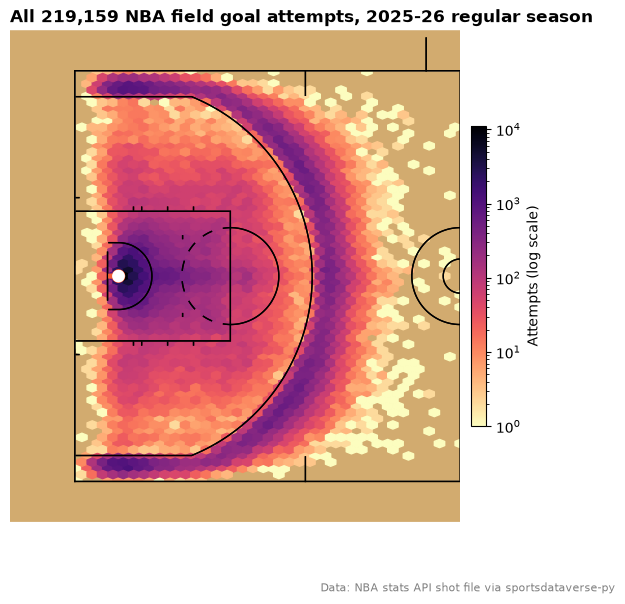
NBACourt.hexbin bins the points into hexagons sized in feet (binsize) and clips them to the court.
display_range="defense" draws only the left half, where every shot is. The log color scale keeps the rim, which
has many times more attempts than anywhere else, from washing out the rest: the rim, the corners and the arc are
the darkest, and the long two in between takes about a tenth as many shots as the arc.
court = NBACourt()
fig, ax = plt.subplots(figsize=(7, 6.5))
court.draw(ax=ax, display_range="defense")
hexes = court.hexbin(shots["court_x"], shots["court_y"], binsize=1.5, bins="log", cmap="magma_r", mincnt=1, ax=ax)
fig.colorbar(hexes, ax=ax, shrink=0.6, pad=0.02, label="Attempts (log scale)")
ax.set_title(f"All {shots.height:,} NBA field goal attempts, 2025-26 regular season", loc="left", fontweight="bold")
fig.text(0.99, 0.01, "Data: NBA stats API shot file via sportsdataverse-py", ha="right", fontsize=8, color="grey")
plt.show()
3. What a shot is worth from each distance
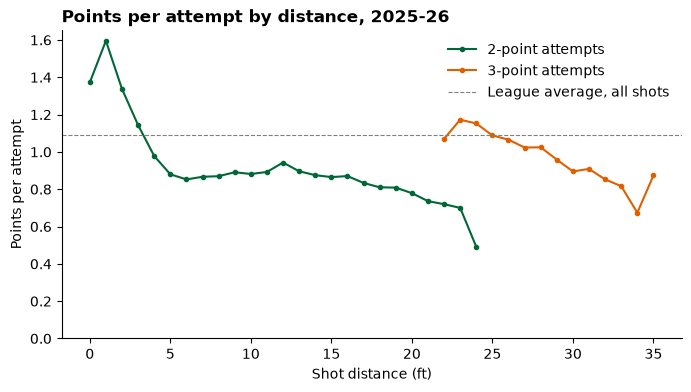
The league's average points per attempt at each distance (in whole feet, with everything past 35 feet pooled) and shot value is the baseline for the rest of the recipe: an average team's expected return on the same shot. A two at the rim is worth well over a point; the long two is the worst shot on the floor, and a step back behind the arc is worth more than a step in.
expected = (
    shots.with_columns(dist=pl.col("shot_distance").clip(upper_bound=35))
    .group_by("dist", "shot_value")
    .agg(attempts=pl.len(), xpts=pl.col("points").mean())
    .filter(pl.col("attempts") >= 50)
    .sort("dist")
)

fig, ax = plt.subplots(figsize=(8, 4))
for value, color in ((2, "#006838"), (3, "#e06000")):
    line = expected.filter(pl.col("shot_value") == value)
    ax.plot(line["dist"], line["xpts"], marker="o", ms=3, color=color, label=f"{value}-point attempts")
ax.axhline(shots["points"].mean(), color="grey", lw=0.8, ls="--", label="League average, all shots")
ax.set(xlabel="Shot distance (ft)", ylabel="Points per attempt", ylim=(0, None))
ax.spines[["top", "right"]].set_visible(False)
ax.legend(frameon=False)
ax.set_title("Points per attempt by distance, 2025-26", loc="left", fontweight="bold")
plt.show()
4. Points over expected, shot by shot
Join the baseline back onto every shot and each one gets an expected value, xpts. A make from a spot where the
league scores 1.1 points per attempt is worth 2 - 1.1 = +0.9 over expected, a miss there -1.1. Summed over a
season, that separates teams that take good shots (a high xpts per attempt) from teams that make the shots they
take (a high over per attempt).
shots = shots.with_columns(dist=pl.col("shot_distance").clip(upper_bound=35)).join(
    expected.select("dist", "shot_value", "xpts"), on=["dist", "shot_value"], how="left"
).with_columns(over=pl.col("points") - pl.col("xpts"))

teams = (
    shots.drop_nulls("xpts")
    .group_by("team_tricode")
    .agg(attempts=pl.len(), pts=pl.col("points").mean(), xpts=pl.col("xpts").mean(), over=pl.col("over").mean())
    .sort("over", descending=True)
)
with pl.Config(float_precision=3, tbl_rows=10):
    print(pl.concat([teams.head(5), teams.tail(5)]))
| team_tricode | attempts | pts | xpts | over |
|---|---|---|---|---|
| LAL | 6863 | 1.146 | 1.069 | 0.077 |
| DEN | 7196 | 1.154 | 1.079 | 0.075 |
| BOS | 7398 | 1.106 | 1.052 | 0.053 |
| LAC | 6857 | 1.118 | 1.072 | 0.045 |
| MIL | 7012 | 1.131 | 1.093 | 0.037 |
| PHI | 7404 | 1.061 | 1.098 | -0.037 |
| CHI | 7417 | 1.095 | 1.146 | -0.051 |
| POR | 7389 | 1.067 | 1.119 | -0.051 |
| BKN | 6933 | 1.041 | 1.106 | -0.065 |
| NOP | 7420 | 1.054 | 1.122 | -0.068 |
5. Where the best and worst shooting teams beat the league
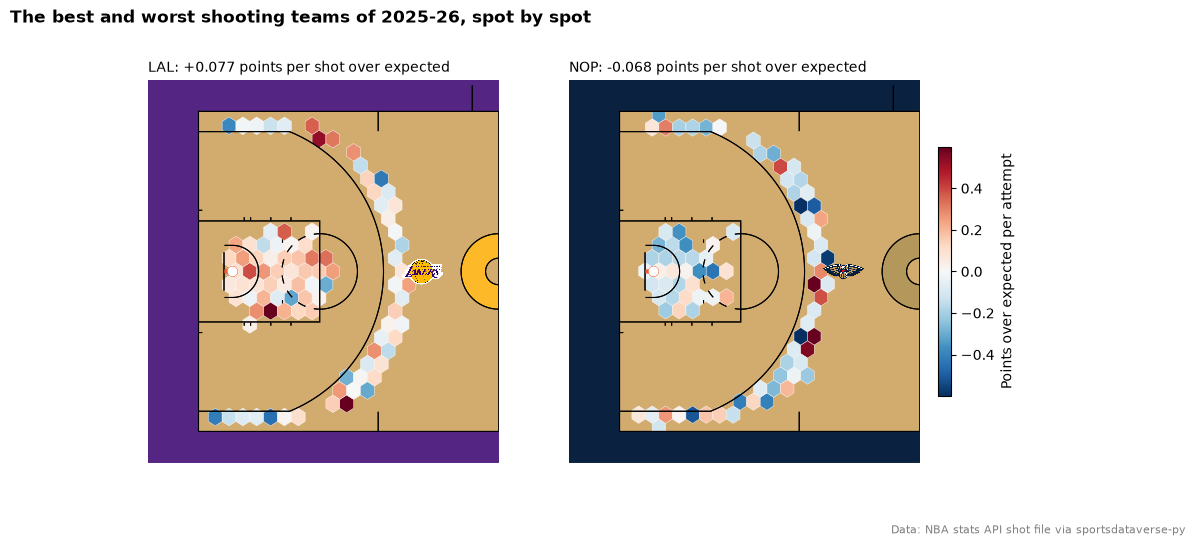
Pass over as the hexbin's values and each hexagon shows the team's average points over expected there
(mincnt leaves out spots with too few attempts to say). A diverging palette centered on zero puts the league
average in white. The courts are painted in each team's colors from sdvplot (team_colors), handed to sportypy as
color_updates, and add_logos puts the team's logo beyond the arc.
best, worst = teams["team_tricode"][0], teams["team_tricode"][-1]
norm = TwoSlopeNorm(vcenter=0, vmin=-0.6, vmax=0.6)

fig, axes = plt.subplots(1, 2, figsize=(12, 5.4))
for ax, team in zip(axes, (best, worst)):
    primary = sdvplot.team_colors("nba", team)
    secondary = sdvplot.team_colors("nba", team, which="secondary")
    court = NBACourt(color_updates={"court_apron": primary, "center_circle_fill": secondary})
    court.draw(ax=ax, display_range="defense")
    mine = shots.filter((pl.col("team_tricode") == team) & pl.col("over").is_not_null())
    hexes = court.hexbin(mine["court_x"], mine["court_y"], values=mine["over"], binsize=4, mincnt=20,
                         cmap="RdBu_r", norm=norm, edgecolors="white", linewidths=0.3, ax=ax)
    sdvplot.add_logos(ax, [-12], [0], [team], league="nba", height=0.12, zorder=30)
    row = teams.filter(pl.col("team_tricode") == team).row(0, named=True)
    ax.set_title(f"{team}: {row['over']:+.3f} points per shot over expected", loc="left", fontsize=10)
fig.colorbar(hexes, ax=axes, shrink=0.6, pad=0.02, label="Points over expected per attempt")
fig.suptitle("The best and worst shooting teams of 2025-26, spot by spot", x=0.01, ha="left", fontweight="bold")
fig.text(0.99, 0.01, "Data: NBA stats API shot file via sportsdataverse-py", ha="right", fontsize=8, color="grey")
plt.show()
Where to go next
- The
NBACourtreference lists every featurecolor_updatescan repaint, and the plotting reference every option ofhexbin,heatmapandcontour. - sdvplot's surfaces and shot charts cookbook draws single-player shot charts on team-colored courts in one call.
- Swap
nbaforwnba(load_wnba_stats_shots,sdvplot.court_coordsandsportypy'sWNBACourt) and the recipe runs unchanged on the WNBA.